
Tracking Efficiency in TrainingPeaks
Endurance sports are all about building efficiency. One way to track efficiency is to study the relationship between watts and heart rate.
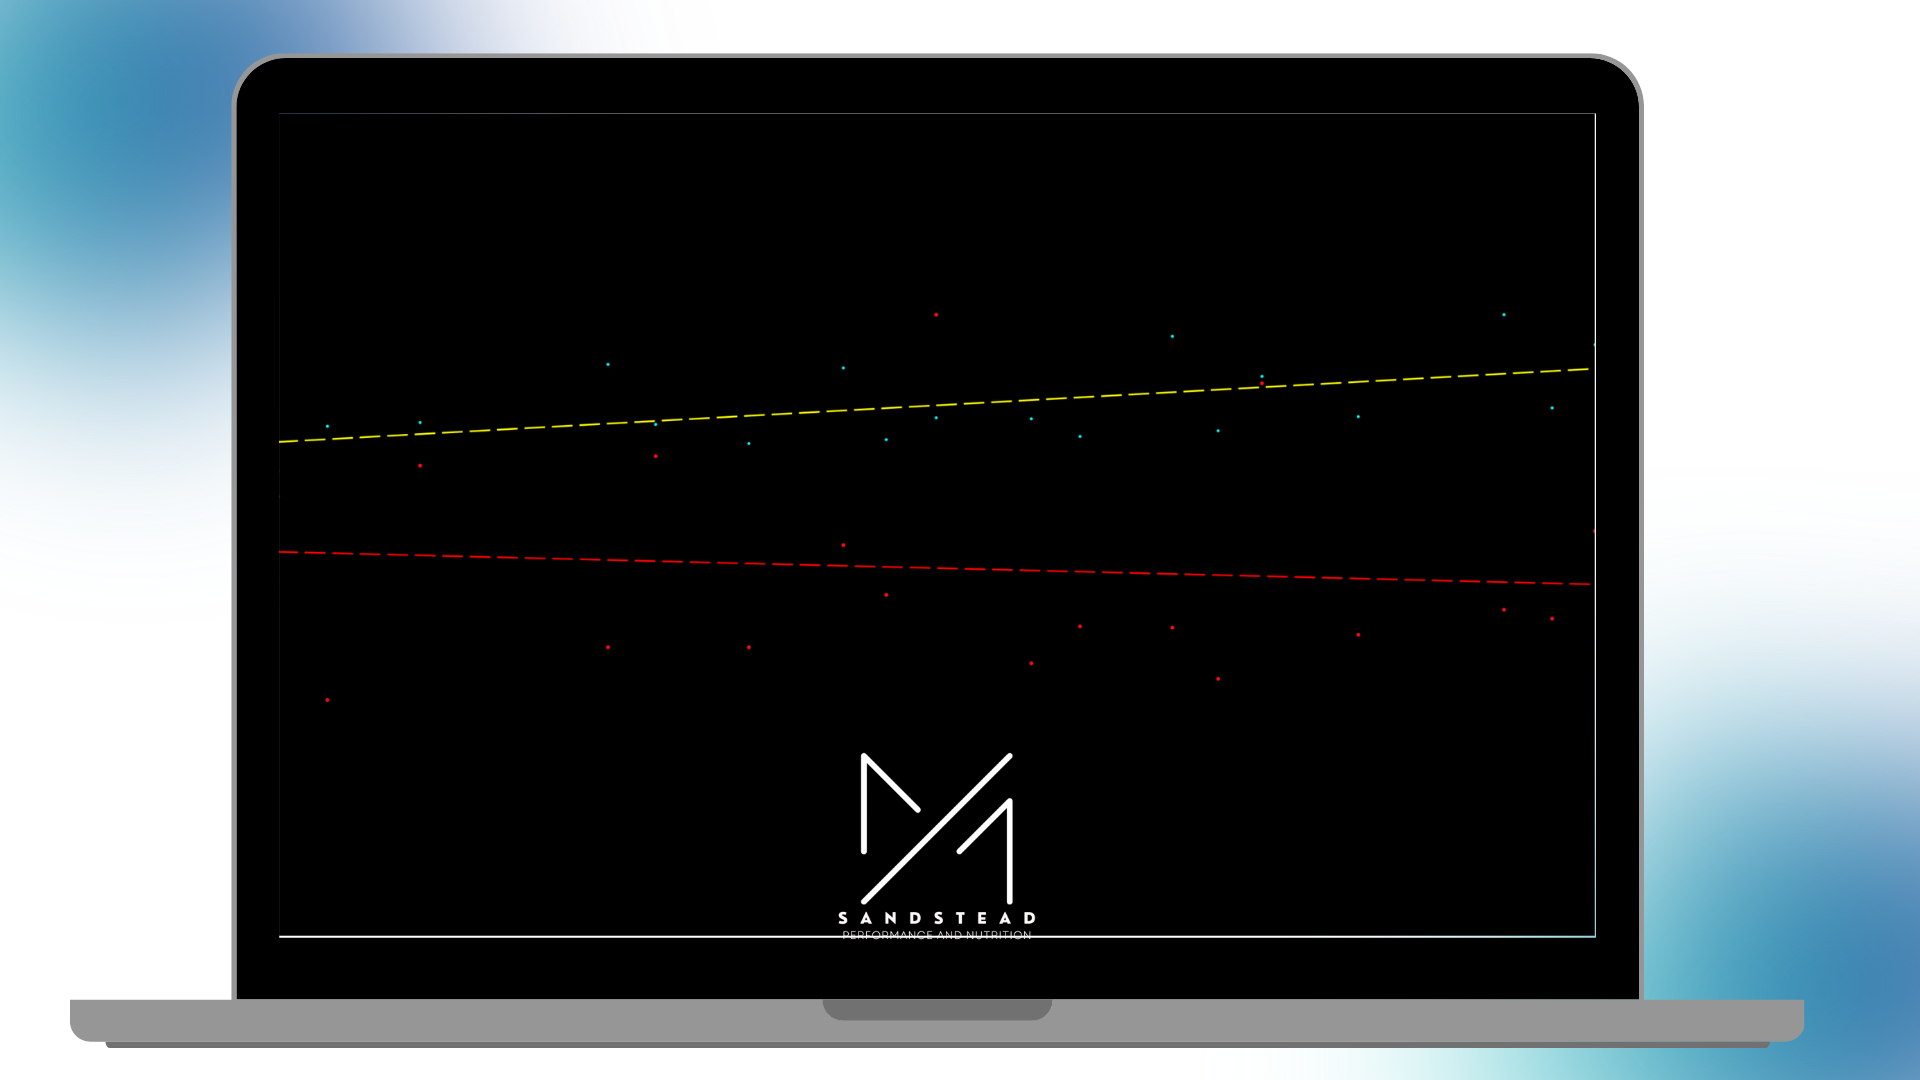
With athlete's I work with, I rigorously track efficiency. Here is chart from the last 30 days from an athlete who really nailed a training block.
The yellow line represents a metric in TrainingPeaks called "EF," which is basically how many watts per heart beat an athlete can do. The red line is another TrainingPeaks metric called "PW:HR." This metric compares the EF from the first half of the workout to the second half of the workout, and an aerobically fit athlete will have a small difference between the two.
The yellow line trends upwards, which is what we want. This means he is doing more watts per heart beat over time.
The red line trends downwards, which is also what we want. It shows that the relationship between PWR and HR has improved over the past 30 days.
To put in super simple layman's terms: at the beginning of the 30-day block when doing tempo intervals, the athlete's HR was really jacked up by the end of the last interval. At the end of the 30-day block, the athlete's HR was a thing of beauty at the end of his tempo intervals.
Moving forward!


FTP work is pain! But when should you be doing FTP intervals? Are they something you should just throw into your calendar when you feel like it, or should they be part of a dedicated program of progression and developed in the context of your events?